
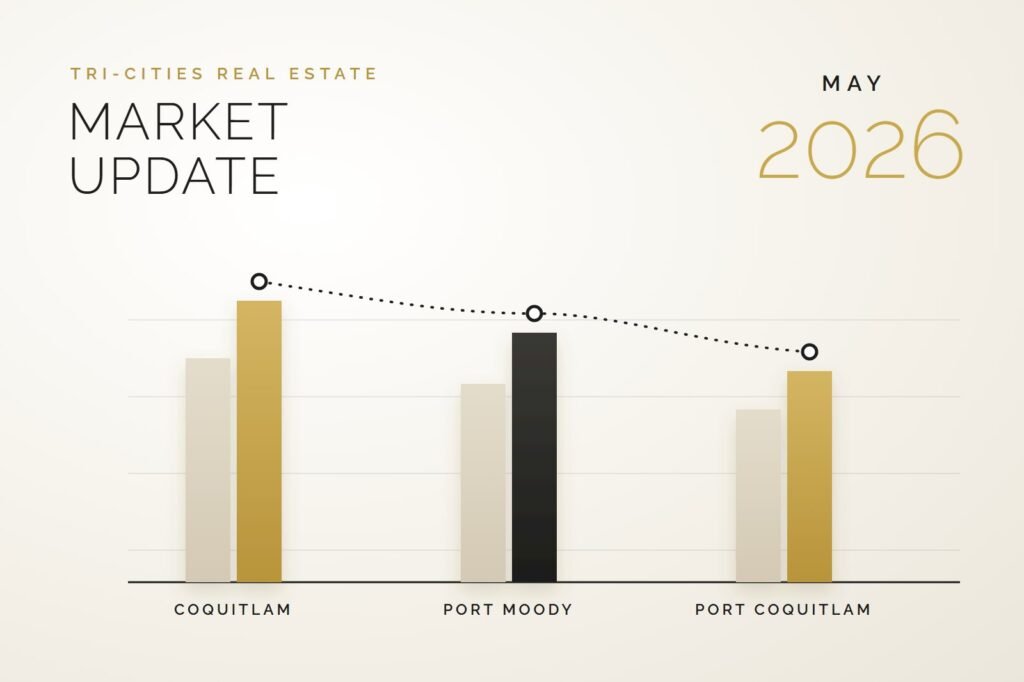
Tri-Cities market report · Week of May 4, 2026
Coquitlam, Port Moody & Port Coquitlam real estate market update — May 2026
Here is the weekly real estate market update for the Tri-Cities — Coquitlam, Port Moody, and Port Coquitlam — for the week of May 4, 2026. This report covers active listing inventory, median sold prices, days on market, and sale-to-list price ratios for both attached and detached homes, broken down by neighbourhood. Data is sourced directly from the Paragon MLS® system. Browse current Tri-Cities listings →
The headline this week: attached product is moving at a healthy clip — 103 sales across 1,290 active listings in the last 30 days, with SP/LP ratios above 97% in all three cities. Detached homes are a different story. Coquitlam detached listings are sitting an average of 108 days before selling, and the gap between average list price ($2.14M) and median sold price ($1.515M) signals persistent overpricing in that segment. Port Coquitlam continues to offer the lowest entry points in both categories.
Attached homes · 1,290 active · 103 solds (30 days)
Attached market — condos, townhomes & duplexes
Tri-Cities attached real estate data for the week of May 4, 2026.
Coquitlam
Port Moody
Port Coquitlam
Attached sales by neighbourhood (last 30 days)
| Neighbourhood | Sales | Med sold | DOM | $/sqft | SP/LP |
|---|---|---|---|---|---|
| Coquitlam West | 29 | $615,000 | 39.6 | $837 | 97.5% |
| New Horizons | 10 | $638,450 | 19.1 | $788 | 99.0% |
| Burke Mountain | 8 | $1,178,950 | 31.6 | $655 | 98.2% |
| North Coquitlam | 6 | $704,950 | 35.7 | $730 | 96.1% |
| Westwood Plateau | 4 | $970,000 | 21.8 | $603 | 98.6% |
| Central Coquitlam | 4 | $660,000 | 24.0 | $693 | 97.6% |
| Coquitlam East | 2 | $820,750 | 10.5 | $611 | 99.5% |
| Ranch Park | 1 | $779,900 | 8.0 | $530 | 100.0% |
Detached homes · 726 active · 53 solds (30 days)
Detached market — single-family homes
Tri-Cities detached real estate data for the week of May 4, 2026.
Coquitlam
Port Moody
Port Coquitlam
Days on market — active listings, attached vs detached
Detached sales by neighbourhood (last 30 days)
| Neighbourhood | Sales | Med sold | DOM | $/sqft | SP/LP |
|---|---|---|---|---|---|
| New Horizons | 5 | $1,268,000 | 9.8 | $646 | 98.0% |
| Ranch Park | 5 | $1,700,000 | 29.2 | $603 | 96.7% |
| Coquitlam East | 4 | $1,574,950 | 20.8 | $553 | 97.8% |
| Central Coquitlam | 3 | $1,450,000 | 8.3 | $433 | 97.3% |
| Westwood Plateau | 2 | $1,910,000 | 65.0 | $397 | 94.3% |
| Burke Mountain | 2 | $2,177,500 | 51.5 | $494 | 91.3% |
| Coquitlam West | 1 | $1,870,000 | 6.0 | $634 | 98.5% |
| Harbour Place | 1 | $2,560,000 | 142.0 | $505 | 93.1% |
Key takeaways
Attached SP/LP is above 97% across all three cities. Detached SP/LP ranges from 95.86% to 97.41%, and Coquitlam detached is averaging 108 days on market before selling.
Port Moody leads on median sold in both segments — $825,000 attached and $1,952,500 detached — while maintaining competitive SP/LP ratios.
Lowest avg list prices in both segments. Central PoCo condos sold at a median of $577,450. Citadel PQ detached closed at $1,472,000 with a 98.9% SP/LP ratio.
New Horizons: 5 detached sales, 9.8 avg DOM. Central Coquitlam: 3 sales, 8.3 avg DOM. Accurate pricing is rewarded — overpriced inventory is sitting.
Frequently asked questions
Tri-Cities real estate — common questions
What is the average home price in Coquitlam in 2026?
As of May 2026, the average list price for attached homes in Coquitlam is $801,676, with a median sold price of $700,000. For detached homes, the average list price is $2,143,964, with a median sold price of $1,515,000. Prices vary significantly by neighbourhood — Burke Mountain and Westwood Plateau skew higher, while North Coquitlam and Coquitlam West offer lower entry points.
How long are homes sitting on the market in the Tri-Cities?
Attached homes are moving faster, averaging 48–62 days on market across the Tri-Cities. Detached homes are sitting considerably longer: 108 days in Coquitlam, 81 days in Port Coquitlam, and 76 days in Port Moody. Well-priced detached listings in neighbourhoods like New Horizons and Central Coquitlam are selling in under 10 days, which shows the spread is largely driven by overpriced inventory.
Is it a buyer’s or seller’s market in the Tri-Cities right now?
Conditions differ by property type. The attached market is relatively balanced, with SP/LP ratios near 98% and consistent sales volume. The detached market favours buyers — inventory is elevated, homes are sitting longer, and sellers are accepting offers below list price. In Coquitlam, the gap between the average list price and median sold price for detached homes is over $600,000, which reflects both overpricing and softening demand in that segment.
What is the most affordable neighbourhood to buy a condo in the Tri-Cities?
Central Port Coquitlam posted the lowest median sold price for attached homes this period at $577,450, followed by Cape Horn in Coquitlam at $430,000 (one sale). For buyers prioritizing affordability in the attached segment, Port Coquitlam and North Coquitlam offer the lowest entry points. Note that Cape Horn and Glenwood PQ tend to have older strata inventory, which can affect financing and insurance options.
Which Tri-Cities neighbourhood has the highest real estate prices?
For detached homes, Anmore and the Barber Street/Belcarra area in Port Moody carry the highest average list prices, with Anmore active listings averaging $3,286,996. Among sold properties this period, Heritage Woods PM led Port Moody detached at a $2,370,000 median. For attached homes, Burke Mountain in Coquitlam recorded the highest neighbourhood median sold at $1,178,950.
How do I know if a home is priced correctly in this market?
The SP/LP ratio (sale price as a percentage of list price) is the clearest signal. In this market, attached homes are trading at 97–99% of list price, meaning well-priced listings are selling close to ask. Detached homes with SP/LP below 96% or DOM above 60 days are typically overpriced relative to what buyers are willing to pay. If a detached listing in Coquitlam is priced above $1.6M and has been on the market more than 60 days, that is a clear signal the price is disconnected from current demand. A comparative market analysis (CMA) from a local REALTOR® is the most reliable way to assess accurate pricing.
Free Instant Estimate
What’s My Home Worth?
Get a data-driven estimate based on recent sales in your neighbourhood — Coquitlam, Port Moody, or Port Coquitlam. No obligation, no sign-up required.
Get My Free Home Valuation →Sebastian Czarkowski
REALTOR® · Royal LePage Elite West · Coquitlam, BC
Questions about buying or selling in the Tri-Cities? Reach out directly.
Data sourced from Paragon MLS® system · Week of May 4, 2026 · For educational purposes only. Not intended as financial or legal advice. Verify all data independently.
Sebastian Czarkowski, REALTOR® | Royal LePage Elite West | sebastianrealestate.ca